Are Home Solar Panels Worth It in 2026? (The Truth Nobody Tells You)
Here’s what solar companies won’t tell you about your home solar panels:
Claiming you’ll “save $2,000 per year” sounds impressive. But what actually matters is this single question:
How long until you get your money back?
That’s the payback period. And it changes everything.
A system that saves money but takes 18 years to break even is completely different from one that pays for itself in 5 years. Yet most solar salespeople gloss over this number.
The reality? Solar isn’t automatically good or bad. It depends on your location, roof conditions, electricity rates, and honest numbers—not marketing promises.
This guide covers exactly what engineers and budget-conscious homeowners need to know.

What Actually Determines Your Solar Payback Period? (The Math)
The formula is straightforward:
Payback Period (years) = Total Installed Cost ÷ Annual Savings
But here’s where it gets real: each variable hides complexity.
1. Installation Costs (The Honest Breakdown)
When a company quotes you a price, it includes:
- Solar panels (the modules themselves)
- Inverter (converts DC to AC power)
- Mounting hardware (racking system)
- Labor (installation time)
- Electrical protection (breakers, wiring, disconnect switches)
- Permits & inspections (required by local authorities)
- Taxes & fees (varies by region)
The national average in the USA ranges from $2.50–$3.50 per watt after incentives. A 5 kW system typically costs $12,500–$17,500 installed.
In Morocco or Spain, costs are often 10–20% lower due to lower labor costs, making the business case even stronger.
2. Incentives That Actually Reduce Costs
This is where real money appears:
- Federal tax credits (USA: 30% of system cost in 2026)
- State rebates (varies by location)
- Utility rebates (often $1,000–$2,000)
- Feed-in tariffs (Europe pays you for exported power)
- Net metering credits (store value for nighttime use)
- Performance grants (Morocco, Spain offer these)
Don’t ignore these. They often reduce your net cost by 30–50%.
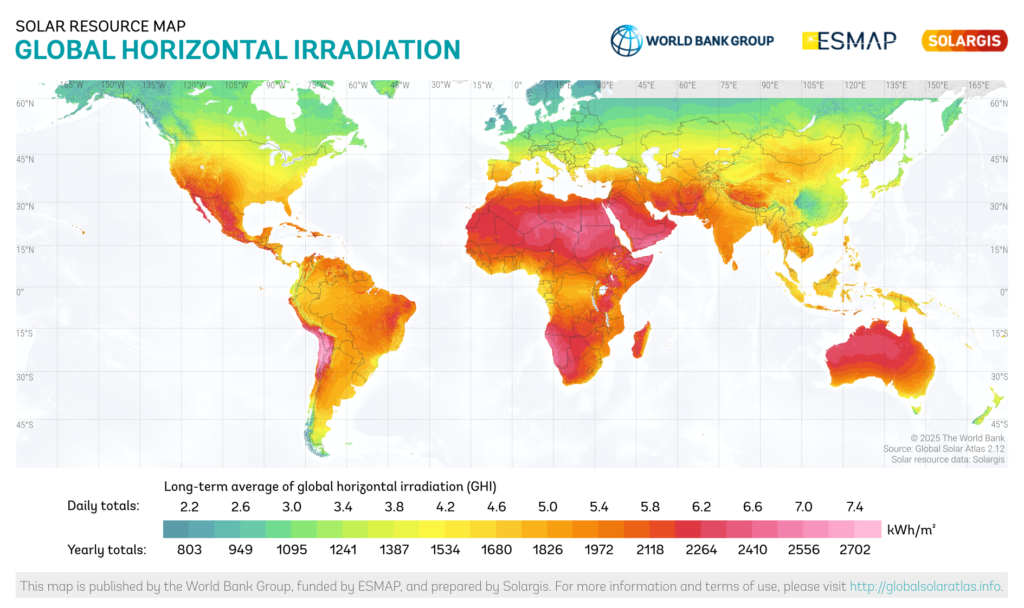
3. Sunlight Hitting Your Roof (GTI—Global Tilted Irradiation)
This is the hidden physics that determines everything.
GTI measures how much solar energy actually hits your roof after accounting for:
- Latitude and season
- Cloud cover
- Atmospheric conditions
- Your roof’s angle and orientation
A 5 kW system in sunny Marrakech produces vastly different output than the same system in cloudy London. Same panels. Different outcomes.
Real-world examples:
- Marrakech (Morocco): 5 kW system produces 8,500–9,500 kWh/year
- Madrid (Spain): 5 kW system produces 7,500–8,500 kWh/year
- London (UK): 5 kW system produces 4,000–5,000 kWh/year
That’s why location is the #1 factor in solar success.
4. Your Electricity Rate (What You Currently Pay)
If your utility charges high rates, solar savings multiply.
Examples in 2026:
- California: $0.18–$0.22 per kWh → High savings potential
- Texas: $0.11–$0.14 per kWh → Good savings
- Morocco: $0.05–$0.08 per kWh → Lower savings but still viable due to low install costs
- Germany: $0.25–$0.28 per kWh → Excellent savings potential
Higher rates = Faster payback. Simple as that.
5. Self-Consumption Rate (The Most Underrated Factor)
Here’s a secret engineers care about:
Using your own solar energy directly (self-consumption) is almost always worth more than exporting it to the grid.
Why? Export rates are usually 50–70% of your retail rate.
Smart homeowners align usage with solar production:
- Run AC cooling during peak sun (noon–3 PM)
- Charge devices and batteries during production hours
- Shift water heating to midday
This can improve ROI by 15–25% without adding a single panel.
Solar Payback by Region: Real Numbers for 2026
Morocco: 4–7 Years ⭐ Best Market
Why Morocco wins:
- Excellent solar irradiation (25–30° latitude advantage)
- Low installation costs
- Growing solar awareness
- Hot climate = high AC demand = peak solar generation during peak usage
Example: A 5 kW system costs ~85,000–95,000 MAD installed, saves 8,000–12,000 MAD/year in electricity. Payback: 5–6 years
Cities like Marrakech, Casablanca, and Agadir are among the world’s best residential solar opportunities.
Spain: 5–8 Years ⭐ Strong Market
Why Spain works:
- 2,700+ peak sun hours annually
- Feed-in tariffs make exports valuable
- Established solar industry = competitive pricing
- Mediterranean climate = consistent sun year-round
Example: A 6 kW system costs ~10,000–12,000 EUR installed, saves 1,200–1,500 EUR/year. Payback: 7–8 years
Southern regions (Andalusia, Murcia) perform better than northern areas.
California: 5–8 Years ⭐ Excellent Market
Why California leads:
- High electricity rates ($0.18–$0.22/kWh)
- Consistent sunshine
- Mature solar market = competitive pricing
- Strong state incentives
- High cooling demand = peak solar during peak usage
Example: A 6 kW system costs ~15,000–18,000 USD after federal tax credit (30%), saves 2,000–2,400 USD/year. Payback: 6–7 years
This is why California homeowners embrace solar—it actually makes financial sense.
Texas: 6–10 Years ✅ Good Market
Why it works:
- Strong sunlight (especially west Texas)
- Electricity cheaper than California BUT still viable
- Growing solar market = better prices
- Summer AC peak aligns perfectly with solar generation
Example: A 6 kW system costs ~14,000–16,000 USD after incentives, saves 1,400–1,800 USD/year. Payback: 8–10 years
Best in western regions (Austin, San Antonio, El Paso).
New York: 7–11 Years ⚠️ Moderate Market
Why it’s slower:
- Less peak sun than southern states
- Colder climate = winter heating not solar-powered
- BUT: High electricity rates ($0.18–$0.22/kWh) help
Example: A 6 kW system costs ~16,000–19,000 USD, saves 1,400–1,700 USD/year. Payback: 9–11 years
Still worthwhile if roof is south-facing and shade-free.
Germany: 8–12 Years ⚠️ Viable with Incentives
Why it’s longer:
- Lower irradiation (only 1,000–1,200 peak sun hours/year)
- BUT: Very high electricity rates ($0.25–$0.28/kWh)
- Strong feed-in tariffs
- Excellent inverter replacement warranties
Example: A 5 kW system costs ~8,000–10,000 EUR, saves 1,000–1,200 EUR/year. Payback: 8–10 years
Germans embrace solar anyway because long-term savings are substantial.
United Kingdom: 11–17 Years ⚠️ Weaker Case
Why it’s tough:
- Low irradiation (900–1,000 peak sun hours/year)
- Less consistent sunshine
- BUT: Some incentive programs exist
Example: A 5 kW system produces 4,000–5,000 kWh/year, saves £600–£900/year. Payback: 13–17 years
Solar works in UK only if electricity rates are very high OR roof orientation is exceptional.
How Much Power Will Your Roof Actually Produce? (The Physics)
The big question: How many kWh/year?
This depends on:
- Roof orientation (south-facing = best)
- Roof tilt angle (closer to latitude = better)
- Shading (trees, buildings, chimneys—the silent killer)
- Panel efficiency (450W vs 400W vs 350W panels)
- Temperature (panels lose efficiency when hot—counterintuitive but true)
- Dust & soiling (especially in dry climates like Morocco)
- Inverter efficiency (typically 95–98%)
Real-World Production Comparison
Same 5 kW system, three locations:
| Location | Conditions | Annual Output |
|---|---|---|
| Marrakech | High sun, 25° tilt, minimal shade | 8,500–9,500 kWh |
| Madrid | Good sun, 32° tilt, light shade | 7,200–8,000 kWh |
| London | Low sun, 35° tilt, some shade | 4,000–5,000 kWh |
Key insight: Same hardware, different outcomes based on location.
A professional shading analysis is worth the $200–$500 cost. It reveals whether your roof is actually viable.
The Hidden Truth: Panel Degradation & Maintenance Costs
Here’s what solar companies rarely mention:
Panel Degradation (It’s Real)
Modern solar panels degrade gradually:
- First year: 2–3% output loss
- Subsequent years: 0.3–0.7% per year
This means:
- After 10 years: ~97% original capacity
- After 25 years: 88–92% original capacity
It’s not catastrophic, but it affects long-term ROI. Your year 25 savings are lower than year 1 savings.
Budget for this: Reduces effective annual savings by ~0.3% each year.
Inverter Replacement (The Surprise Cost)
Inverters are the weak link:
- Typical lifespan: 10–15 years
- Replacement cost: $1,000–$3,000 depending on size
- Not usually under warranty after year 10
If your system lasts 25 years, expect one inverter replacement around year 12.
This is a significant cost. Don’t ignore it in ROI calculations.
Cleaning & Maintenance
This is huge in dry climates:
- Dust accumulation reduces output by 10–20% in arid regions
- Annual cleaning in Morocco, Middle East, Spain is almost essential
- Cost: $100–$300/year for professional cleaning
Self-cleaning? Possible but risky (roof safety, water damage).
Budget for annual maintenance if you’re in a dusty climate.
Realistic Long-Term Costs
A 25-year system might include:
- 1 inverter replacement ($1,500–$2,500)
- 5–10 annual cleanings in dusty areas ($500–$3,000 total)
- Minor repairs/wiring maintenance ($500–$1,000)
Total hidden costs: $2,500–$6,500 over 25 years
That’s $100–$260/year. Reduce your claimed annual savings accordingly.
Should You Add a Solar Battery? (The Honest Answer)
Battery costs have dropped, but they’re still expensive: $8,000–$15,000 installed for a usable 10 kWh battery.
Batteries Make Sense If:
- You have frequent power outages
- Nighttime electricity rates are 2–3x daytime rates (time-of-use pricing)
- Poor export tariffs (you’re paid little for excess solar)
- You want true energy independence
- Government rebates cover 30–50% of costs
Batteries Don’t Make Sense If:
- You have reliable grid connection
- Export rates are decent (50%+ of retail)
- You’re budget-conscious
- You just want ROI maximization
The Budget-Smart Strategy
Install solar now, batteries later.
Why?
- Battery prices drop 5–10% annually
- Your solar system produces for 2–3 years while you wait
- You can assess if batteries actually solve a real problem
- By 2028–2030, batteries will be 20–30% cheaper
This approach maximizes ROI while preserving optionality.
How Many Solar Panels Do You Actually Need?
Size depends on annual electricity consumption.
Quick Sizing Guide
| Annual Usage | System Size | Panel Count (450W panels) |
|---|---|---|
| 3,000 kWh | 2.5 kW | 6 panels |
| 5,000 kWh | 4 kW | 9 panels |
| 7,000 kWh | 5–6 kW | 11–13 panels |
| 10,000 kWh | 7–8 kW | 16–18 panels |
| 15,000 kWh | 10+ kW | 22+ panels |
The Right Approach: Load Analysis
Get a 12-month electricity bill history. This shows:
- Peak usage months
- Total annual consumption
- Usage patterns
Then size to cover 70–90% of annual usage. Why not 100%?
- Adding the last 10% costs disproportionately more
- You use less in shoulder seasons
- Grid handles overflow cheaply
- Better ROI with slightly undersized system
Roof Orientation & Tilt Angle: Does It Matter?
Yes—but less than people think.
Best Orientation (Northern Hemisphere)
- True South = Best (100% rating)
- South-East or South-West = Nearly as good (90–95% rating)
- East or West = Acceptable (70–85% rating)
- North = Poor (avoid if possible)
In Southern Hemisphere, reverse directions.
Best Tilt Angle
Close to your latitude is ideal:
- Marrakech (32°N): 28–32° is optimal
- Madrid (40°N): 35–40° is optimal
- Texas (32°N): 28–32° is optimal
Roof slope already set? Don’t worry. Anywhere 20–45° is acceptable. Performance drops <5% even if slightly off-optimal.
Trackers: Worth It?
Single-axis trackers add 20–30% output but cost $3,000–$8,000 extra.
The engineering verdict: Not worth it for homes.
Why?
- Extra 20% output ≠ Extra 20% profit (costs too much)
- More moving parts = more maintenance
- Usually better to add one extra panel ($500–$800) instead
Trackers make sense for commercial/utility-scale, not residential.
5 Critical Questions to Ask Before Signing a Solar Contract
Red flags matter. Ask these:
Technical Questions
- “What annual kWh production do you guarantee in writing?”
- Vague answer = red flag
- Should include shading analysis and location-specific data
- “What inverter brand and model?”
- Quality matters (SMA, Fronius, Enphase are solid)
- Cheap inverters fail sooner
- “What panel degradation warranty?”
- Standard: 80% capacity after 25 years
- Better: 90% after 25 years
- “Did you do a professional shading analysis?”
- Shows they’re thorough
- Reveals if trees/buildings block sun
- “What’s your DC/AC ratio?”
- Shows system design maturity
- Typical range: 1.0–1.3 (higher = better clipping management)
Financial Questions
- “What’s the total price after all incentives?”
- Must include fed tax credit, rebates, utility incentives
- Claim any suspicious savings—ask for documentation
- “What’s your estimated payback period?”
- If >10 years, reconsider
- If 5–8 years, likely solid
- “What happens with export tariffs/net metering?”
- How much are you paid for excess power?
- How is it calculated (per kWh? monthly true-up?)
- “What maintenance costs should I budget?”
- Honest installers admit inverter replacement costs
- Claim cleaning needs in dusty regions
- “Is inverter replacement covered or excluded?”
- Most warranties don’t cover after year 10
- Budget separately
If installer dodges these questions, find another company.
The Final Verdict: Is Solar Worth It in 2026?
YES, Install Solar If:
✅ Payback period under 8 years
✅ Electricity rates high ($0.12+/kWh)
✅ South-facing roof with minimal shade
✅ Plan to stay 10+ years
✅ Good sunlight in your region
MAYBE, Consider If:
⚠️ Payback period 8–12 years
⚠️ Moderate sun, decent rates
⚠️ Considering moving in 5–7 years
⚠️ Roof needs work first
WAIT If:
❌ Payback period >13 years
❌ Severe shading
❌ Very low electricity usage
❌ Roof needs replacement soon
❌ Plans to move within 5 years
Best Markets Right Now (2026)
🌟 Tier 1 (Best ROI): Morocco, Spain, Southern California
✅ Tier 2 (Good ROI): Texas, Arizona, Southern Europe
⚠️ Tier 3 (Acceptable ROI): Germany, New York, Central US
❌ Tier 4 (Weak ROI): UK, Northern Europe, Pacific Northwest
Quick Reference: Solar Payback by Numbers
| Metric | Calculation | Example |
|---|---|---|
| Annual Savings | (kWh/year) × (Price/kWh) | 6,000 × $0.16 = $960/year |
| Payback Period | Total Cost ÷ Annual Savings | $15,000 ÷ $960 = 15.6 years |
| Production Estimate | System Size × Regional Factor | 5 kW × 1,700 hrs/year = 8,500 kWh |
| Break-Even Value | Annual Savings × 25 years | $960 × 25 = $24,000 lifetime value |
Bottom Line: The Smart Homeowner’s Solar Decision
Solar panels in 2026 are mature technology with proven ROI in sunny markets. The question isn’t “Are solar panels good?” but “Are they good for MY home in MY location?“
Run the numbers:
- Get 3 quotes (real companies, not just online estimates)
- Ask for detailed shading analysis and production guarantees
- Calculate payback period honestly (include degradation & maintenance)
- Compare to other investments (they need to beat 6–8% annual returns)
- Only sign if payback ≤ 10 years
If payback exceeds 10 years, wait. Costs keep dropping, and patience rewards you with better economics later.
The best solar system is one with realistic numbers and honest expectations.
Frequently Asked Questions (FAQs)
Modern panels last 25–35 years. Most manufacturers warranty them to 80–90% capacity after 25 years. After that, they still produce 70–80%, just at lower efficiency. Panels don’t “die”—they degrade slowly.
Maybe. If payback is 5–7 years, you break even. If 10+ years, your ROI is negative. Recoup transfers to home value in many markets, but not dollar-for-dollar.
Rarely. Most installer payback projections omit both panel degradation and inverter replacement costs, which together can extend the realistic payback period by two to three years. Always ask specifically whether these costs are included before accepting a quoted payback figure.
Yes. Mid-tier brands (JinkoSolar, Canadian Solar, LONGi) cost 10–15% more than unknowns but last longer, degrade slower, and have better warranty support. Extra $500 upfront saves $3,000 in headaches.
Southeast or southwest works fine (90–95% efficiency). East or west is acceptable (70–85% efficiency). Only true north is problematic. Get a professional shading analysis.
Have questions about solar ROI in your region? Drop a comment below or contact a certified solar engineer in your area.